optuna.visualization
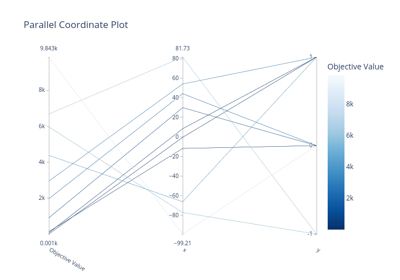
在 visualization 模块中,我们提供使用 plotly 和 matplotlib 绘制优化过程的实用函数。绘图函数通常接受一个 Study 对象,可选参数则作为列表传递给 params 参数。
注意
在 optuna.visualization 模块中,以下函数使用 plotly 创建图表,但 JupyterLab 默认无法渲染它们。请按照此安装指南在 JupyterLab 中显示图表。
注意
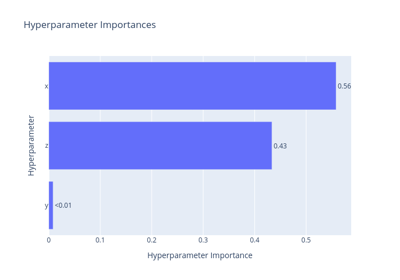
The plot_param_importances() 需要 Python 包 scikit-learn。

注意
以下 optuna.visualization.matplotlib 模块使用 Matplotlib 作为后端。
另请参阅
超参数优化分析的快速可视化 教程提供了包含示例的用例。